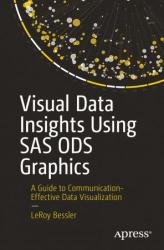
 Название: Visual Data Insights Using SAS ODS Graphics: A Guide to Communication-Effective Data Visualization
Автор: LeRoy Bessler
Издательство: Apress
Год: 2023
Страниц: 627
Язык: английский
Формат: epub (true)
Размер: 95.96 MB
SAS ODS graphics users will learn in this book how to visually understand and communicate the significance of data to deliver images for quick and easy insight, with precise numbers. The data visualization tool used is SAS ODS Graphics, but the principles are software independent, relevant for any tool. Graphs can make it unnecessarily difficult to understand the data, can confuse the viewer, or can mislead the viewer. If a graph needs an explanation, it has failed to communicate. The book presents examples of bar charts, pie charts, and trend lines or time series plots, the graph types commonly used in business, other organizations, and the media for visual insight into data. Newer graphs are also included: dot plots, needle plots, waterfall charts, butterfly charts, heat maps, bubble plots, step plots, high-low plots, and donut charts. In addition, there are basic tools of statistics: scatter plots, box plots, histograms, fit and confidence plots, and distributions.










 Название: The Art of Virtual LEGO Design: Design LEGO Models Using Studio 2.0
 Название: How Computers Make Books: From graphics rendering, search algorithms, and functional programming to indexing and typesetting (MEAP v2)
 Название: Making Presentation Math Computable: A Context-Sensitive Approach for Translating LaTeX to Computer Algebra Systems
 Название: Red Hat RHCSA 9 Cert Guide: EX200 (Rough Cuts)
 Название: Data Mesh in Action (MEAP v5)
 Название: New Approaches to Data Analytics and Internet of Things Through Digital Twin
 Название: Exam Ref SC-300 Microsoft Identity and Access Administrator
 Название: Murach SQL Server 2019 for Developers
 Название: Visualization Techniques for Climate Change with Machine Learning and Artificial Intelligence