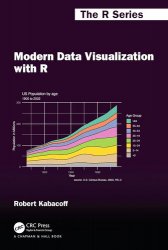
 Название: Modern Data Visualization with R
Автор: Robert Kabacoff
Издательство: CRC Press
Серия: The R Series
Год: 2024
Страниц: 272
Язык: английский
Формат: pdf (true)
Размер: 33.4 MB
Modern Data Visualization with R describes the many ways that raw and summary data can be turned into visualizations that convey meaningful insights. R is an amazing platform for data analysis, capable of creating almost any type of graph. This book helps you create the most popular visualizations–from quick and dirty plots to publication-ready graphs. The text relies heavily on the ggplot2 package for graphics, but other approaches are covered as well. It starts with basic graphs such as bar charts, scatter plots, and line charts, but progresses to less well-known visualizations such as tree maps, alluvial plots, radar charts, mosaic plots, effects plots, correlation plots, biplots, and the mapping of geographic data. Both static and interactive graphics are described and the use of color, shape, shading, grouping, annotation, and animations are covered in detail. The book moves from a default look and feel for graphs, to graphs with customized colors, fonts, legends, annotations, and organizational themes. The book is written for those new to data analysis as well as the seasoned data scientist. The reader should have some basic coding experience, but expertise in R is not required.


