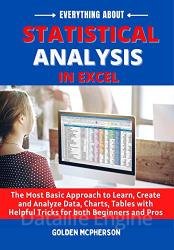
 Название: Statistical Analysis in Excel
Автор: Golden McPherson
Издательство: Independently published
Год: 2022
Страниц: 315
Язык: английский
Формат: pdf, epub
Размер: 23.6 MB
The Most Basic Approach To Learn, Create And Analyze Data, Charts, Tables With Helpful Tricks For Both Beginners And Pros.
The world of Excel is a large one especially filled with all of the special functions for your special duty. Now if you are an Excel enthusiast, you are going to agree with me that Excel gets deep and extensive. The deeper you get into it, the more you understand. And what you understand is a lot.
One thing that makes excel really stand out is that it is easily accessible. Most people with windows laptops have them preinstalled and they are the number one go-to platform for office management and data analysis.
In statistical analysis, the chances are that learning about Excel can be the key for yout growth or to getting that job. But the truth is that not everything about excel is plain and intuitive there is a little technical stuff and it is time for you to learn these things. So, here is the technical stuff. In this book, we have curated some of the common statistical issues and taught you how to solve them with Excel. We have:
Explained how to evaluate data in excel
Explained to a large extend excel statistical capabilities
We tell you what a normal frequency looks like
Introduced standard deviation, covariance, and variance and showed you excel functions to find and analyze them
Regression is also a topic
Trust us, with this manual, no statistical nut will be too tough for you to crack. So here is the deal though it is one thing to say we have a list of directions without any illustrations and it is another thing to say that we created illustrations for you. Now, we have done the latter. This makes it easier for you such that when you are working or trying to use our book to find your way through Excel, you have pictures also to guide you.
Скачать Statistical Analysis in Excel
[related-news] [/related-news]
Комментарии 0
Комментариев пока нет. Стань первым!


