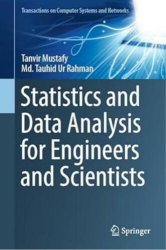
 Название: Statistics and Data Analysis for Engineers and Scientists
Автор: Tanvir Mustafy, Md. Tauhid Ur Rahman
Издательство: Springer
Год: 2024
Страниц: 190
Язык: английский
Формат: pdf
Размер: 10.1 MB
This textbook summarizes the different statistical, scientific, and financial data analysis methods for users ranging from a high school level to a professional level. It aims to combine the data analysis methods using three different programs—Microsoft Excel, SPSS, and MATLAB. The book combining the different data analysis tools is a unique approach. The book presents a variety of real-life problems in data analysis and Machine Learning, delivering the best solution. Analysis methods presented in this book include but are not limited to, performing various algebraic and trigonometric operations, regression modeling, and correlation, as well as plotting graphs and charts to represent the results. Fundamental concepts of applied statistics are also explained here, with illustrative examples. Thus, this book presents a pioneering solution to help a wide range of students, researchers, and professionals learn data processing, interpret different findings derived from the analyses, and apply them to their research or professional fields. The book also includes worked examples of practical problems. The primary focus behind designing these examples is understanding the concepts of data analysis and how it can solve problems. The chapters include practice exercises to assist users in enhancing their skills to execute statistical analysis calculations using software instead of relying on tables for probabilities and percentiles in the present world.
The Chapter 2 delves into the indispensable world of MATLAB, a powerful computational tool that serves as the linchpin of modern data analysis and scientific computation. This chapter offers readers a comprehensive initiation into MATLAB, encompassing fundamental concepts, essential commands, script and function files, arrays, and matrices. Readers will embark on a journey that equips them with the necessary skills for data manipulation, mathematical operations, and statistical analysis. Through a series of hands-on exercises and illustrative examples, this chapter instills proficiency in MATLAB, making it an indispensable asset for subsequent chapters’ applications in statistical analysis and data interpretation. Beginning with an introduction to MATLAB, readers gain insight into the environment and its significance in engineering and scientific disciplines. They navigate through basic commands, empowering them to interact with the software efficiently. Script and function files are introduced, providing the framework for organizing and automating tasks, enhancing the reproducibility of analyses. Arrays and matrices, fundamental data structures in MATLAB, are explored in depth, enabling readers to handle complex datasets and perform advanced computations effortlessly. Practical examples illustrate the versatility of arrays and matrices in engineering and scientific applications. Moreover, readers will learn how to harness MATLAB’s capabilities for mathematical operations, including algebraic functions such as solving linear equations and polynomial curve fitting. These skills are indispensable for addressing real-world problems that engineers and scientists encounter regularly. Incorporating data analysis and statistics, the chapter demonstrates MATLAB’s prowess in managing and interpreting data. Readers will discover how to employ MATLAB for statistical tasks, facilitating data-driven decision-making and hypothesis testing. The chapter also unveils MATLAB’s visualization prowess, with a focus on two-dimensional and three-dimensional plots.
The Chapter 3 plunges readers into the versatile realm of Microsoft Excel, a ubiquitous tool for data analysis, manipulation, and visualization. This chapter is a comprehensive guide to harnessing Excel’s power for engineering and scientific applications. Beginning with an introduction to Excel, readers gain an understanding of its importance in modern data-driven disciplines. The fundamentals of Microsoft Excel are explored, including worksheets, workbooks, rows, columns, and cells. Vital data formatting techniques are introduced, ensuring data presentation clarity. Readers are guided through inputting functions and formulas directly into cells and using the formula bar, unleashing Excel’s computational prowess. The chapter dives into essential mathematical operations, such as SUM, MIN, MAX, and SUMPRODUCT, bolstering data analysis capabilities.
The Chapter 4 immerses readers in the powerful realm of SPSS, a statistical software package widely used for data analysis in various fields. This chapter provides a comprehensive introduction to SPSS, guiding readers through the essential steps for creating and defining variables, entering and sorting data. Building on this foundation, the chapter delves into measures of dispersion, elucidating concepts of central tendency and dispersion, quartiles, percentiles, and box-and-whisker plots. A detailed exploration of frequency distribution further enhances readers’ understanding of data variability. The chapter also unfolds the intricate world of correlation analysis, employing scatter plots and Pearson’s correlation coefficient to measure relationships between variables. Readers gain proficiency in regression analysis, particularly simple linear regression, enabling them to model and interpret linear relationships within data. Visualization capabilities are expanded with guidance on creating line graphs, coding data, crafting bar charts, pie charts, and histograms.
Скачать Statistics and Data Analysis for Engineers and Scientists
[related-news] [/related-news]
Комментарии 0
Комментариев пока нет. Стань первым!
