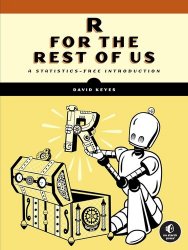
 Название
: R for the Rest of Us: A Statistics-Free Introduction
Автор: David Keyes
Издательство: No Starch Press
Год: 2024
Страниц: 259
Язык: английский
Формат: True/Retail PDF, True/Retail EPUB, True/Retail MOBI
Размер: 70.4 MB
The R programming language is a remarkably powerful tool for data analysis and visualization, but its steep learning curve can be intimidating for some. If you just want to automate repetitive tasks or visualize your data, without the need for complex math, R for the Rest of Us is for you.
Inside you’ll find a crash course in R, a quick tour of the RStudio programming environment, and a collection of real-word applications that you can put to use right away. You’ll learn how to create informative visualizations, streamline report generation, and develop interactive websites—whether you’re a seasoned R user or have never written a line of R code.
Many people think of R as simply a tool for hardcore statistical analysis, but it can do much more than manipulate numerical values. After all, every R user must illuminate their findings and communicate their results somehow, whether that’s via data visualizations, reports, websites, or presentations. Also, the more you use R, the more you’ll find yourself wanting to automate tasks you currently do manually.
As a qualitatively trained anthropologist without a quantitative background, I used to feel ashamed about using R for my visualization and communication tasks. But the fact is, R is good at these jobs. The ggplot2 package is the tool of choice for many top information designers. Users around the world have taken advantage of R’s ability to automate reporting to make their work more efficient. Rather than simply replacing other tools, R can perform tasks that you’re probably already doing, like generating reports and tables, better than your existing workflow.
You’ll also learn how to:
Manipulate, clean, and parse your data with tidyverse packages like dplyr and tidyr to make data science operations more user-friendly
Create stunning and customized plots, graphs, and charts with ggplot2 to effectively communicate your data insights
Import geospatial data and write code to produce visually appealing maps automatically
Generate dynamic reports, presentations, and interactive websites with R Markdown and Quarto that seamlessly integrate code, text, and graphics
Develop custom functions and packages tailored to your specific needs, allowing you to extend R’s functionality and automate complex tasks
Unlock a treasure trove of techniques to transform the way you work. With R for the Rest of Us, you’ll discover the power of R to get stuff done. No advanced statistics degree required.
Who This Book Is For:
No matter your background, using R can transform your work. This book is for you if you’re either a current R user keen to explore its uses for visualization and communication or a non-R user wondering if R is right for you. I’ve written R for the Rest of Us so that it should make sense whether or not you’ve ever written a line of R code. But even if you’ve written entire R programs, the book should help you learn plenty of new techniques to up your game. R is a great tool for anyone who works with data. Maybe you’re a researcher looking for a new way to share your results. Perhaps you’re a journalist looking to analyze public data more efficiently. Or maybe you’re a data analyst tired of working in expensive, proprietary tools. If you have to work with data, you will get value from R.
Contents:
Introduction
Part I: Visualizations
1. An R Programming Crash Course
2. Principles of Data Visualization
3. Custom Data Visualization Themes
4. Maps and Geospatial Data
5. Designing Effective Tables
Part II: Reports, Presentations, and Websites
6. R Markdown Reports
7. Parameterized Reporting
8. Slideshow Presentations
9. Websites
10. Quarto
Part III: Automation and Collaboration
Index
Скачать R for the Rest of Us: A Statistics-Free Introduction
[related-news]
[/related-news]