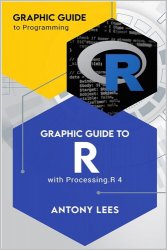
 Название: Graphic Guide to R: with Processing.R 4 (Graphic Guide to Programming)
Автор: Antony Lees
Издательство: Devoniant
Год: 2024
Страниц: 424
Язык: английский
Формат: epub (true)
Размер: 10.1 MB
Ditch the text, unleash the graphic genius! This book is your key to mastering R through the captivating world of data visualization.
With Processing's user-friendly interface, you'll be drawing shapes, animating scenes, and creating interactive experiences – all while mastering the power of R. Forget dry syntax; here, you'll grasp core concepts like variables, loops, and functions by bringing your ideas to life on the screen.
Processing is a free, open-source, programming language based on the much larger R language. It focusses on the visual output of computer programs, designed for non-programmers, and those more experienced, to create visual graphics and animation. Processing includes everything needed to create and view graphics including an IDE (Integrated Development Environment) that can be used to create programs and graphics. Programming languages are often taught using text output like printing “Hello world!”. By using Processing, we can learn R with interesting graphics, giving immediate visual responses to the code you write, which is much more exciting!
The book aims to teach the R programming language to both non-programmers and experienced programmers alike, allowing those who have not worked on computer programs before to become competent in the language and anyone to create some visually stunning graphics and animation using Processing, regardless of prior experience. You will soon discover that there are no real rules to creating graphics in Processing and that minor changes can yield unexpected results. So, my best advice is, try stuff out, see what happens, have fun!
This book is ideal for:
Visual learners who thrive on a hands-on approach.
Scientists and analysts who want to elevate their data storytelling.
Anyone new to coding who wants to learn R in a fun and engaging way.
Get ready to:
Grasp R's core concepts like data structures, functions, and loops – visually!
Build a solid foundation for advanced statistical analysis and data manipulation.
Create informative and beautiful visualizations that bring your data to life.
Learning doesn't have to be dry. Spark your creative fire and unlock the power of R with this groundbreaking guide!
Contents:
Скачать Graphic Guide to R: with Processing.R 4 (Graphic Guide to Programming)
[related-news] [/related-news]
Комментарии 0
Комментариев пока нет. Стань первым!
