


")

, 8th Edition")


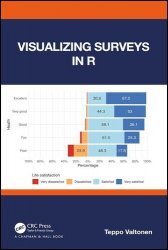 Название: Visualizing Surveys in R
Автор: Teppo Valtonen
Издательство: CRC Press
Год: 2024
Страниц: 327
Язык: английский
Формат: pdf (true), epub (true)
Размер: 102.2 MB
Visualizing Surveys in R is about creating static, print quality figures from survey data using R. The focus is not, for example, on statistical analysis of survey data, but rather on giving concrete solutions for typical problems in visualizing survey data. While there are many excellent books on data visualization, surveys and R, the aim of this book is to bring these topics together, and offer practical instructions for visualizing surveys in R.
Features:
• Introduction to survey dаta: variables, categories, and scales
• Description of a process for visualizing survey data
• Recommendations for reading survey data into R
• Advice on building a survey dataset in R to facilitate versatile plotting
• Step-by-step recipes in R for creating useful plots from survey data
The book is intended for researchers who regularly use surveys and are interested in learning how to seize the vast possibilities and the flexibility of R in survey analysis and visualizations. The book is also valuable for psychologists, marketeers, HR personnel, managers, and other professionals who wish to standardize and automate the process for visualizing survey data. Finally, the book is suitable as a course textbook, either more widely on survey studies, or more strictly on visualizing survey data in R.
Скачать Visualizing Surveys in R
[related-news] [/related-news]
Комментарии 0
Комментариев пока нет. Стань первым!